
A number can't tell you why
Two students reach the same score for completely different reasons. The figure hides both of them.
IMPACT turns assessment results into a clear, written story about each student, class and school, so you read what the numbers mean, not just what they are.
Leaders don't need more numbers. They need to know what the numbers are trying to say.
Two students reach the same score for completely different reasons. The figure hides both of them.
The result rarely shows which child is quietly slipping behind, or who's ready to be stretched.
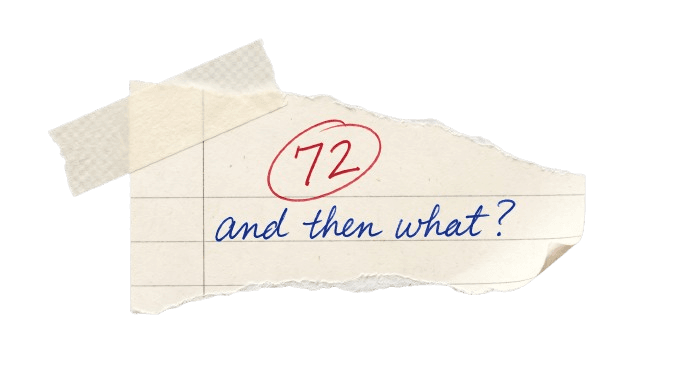
A mark closes the page. Leaders and teachers need the next sentence, not just the last one.
Just the score
English · Class 7
…and then what?
What it says
Ananya understands what she reads and reasons about it well, comprehension is a real strength. Where she loses marks is in getting her thinking onto the page: her answers are shorter than her ideas. She needs practice turning good thinking into full, written answers.
Suggested next step
One short written response a week with a sentence-starter, and praise the explaining, not just the answer.
Written for a parent or a teacher. No jargon, no decoding required.
Observation → Action
A visit produces a rating. A rating produces nothing. IMPACT scores every criterion against your own written expectations, explains what was seen in plain words, and turns the gaps into tasks somebody owns.
Planning and classroom climate are strong - the objective was written up, returned to, and students were comfortable being wrong out loud. The lesson lost ground on distribution: 18 of 23 questions went to the front two rows, and the written task was set as homework rather than attempted in the room.
Six minutes of writing before the discussion, and question from a seating list so the back rows enter the lesson.
Task assigned · Ms. Banerjee · weekly · re-checked at the next observation
Written for the teacher and the coordinator. No jargon, no decoding required.
On site, from a recording, or both. Each criterion is rated by choosing the written expectation that matches what happened.
Comments, photographs, student work and timecoded clips attach to the specific criterion they support.
Strengths, gaps and priorities written for the person receiving them - teacher, coordinator or board.
Weak parameters trigger recommended tasks with owners and dates. The next visit re-checks those criteria first.
An observer scores against your own criteria on phone or laptop, offline if the room has no signal. Structured, consistent, comparable across every teacher.
Upload a recording. Talk share, wait time, question spread and on-task trend measured exactly, with timecoded evidence and a confidence score on every flag.
A single focused window - one department or one grade band - when you need a clear verdict fast. Becomes your baseline if you continue.
Every cycle re-tests the same criteria. Growth is measured, not assumed.
Audit, assessment or video analysis against your defined criteria.
The engine identifies improvement areas, tied to specific criteria.
Tasks auto-created in the Task Manager, deadlines set, owners notified.
The auditee completes tasks; the manager rates quality of completion.
A partial re-audit on the same flagged criteria, fresh evidence.
Compare before / after. Reinforce growth, or escalate stalls.
Clear written reports for every student, class and school, strengths and gaps named in plain language, ready to share.
Independent education auditors for quality reviews, compliance, assessment design and safeguarding. Browse, compare and request the right person for your institution.
The marketplace will open after the first verified reviewers, service scopes and pricing checks are complete.
How the marketplace works
Search verified auditors by sector, location and specialism, charges shown up front.
Send a brief. Compare scope, turnaround and price before you commit to anyone.
Every finding runs through the IMPACT engine, scored, explained and tracked to close.
List the services and charges you offer, reach institutions actively looking, and run every engagement on the IMPACT engine.
Attendance & identity, verified in a glance.
A private feed that keeps your community close.
Every finding becomes a tracked, owned task.
Capture the moments numbers miss.
One place for what everyone needs to know.
Case studies
Six engagements across schools, national programmes and enterprise operations - each one reported with the numbers it actually produced.
Why leaders choose IMPACT
Every figure here is something we can point at in a report - students assessed, teachers observed, reports delivered. Nothing counted twice, nothing rounded up.
Every completed baseline-to-endline cycle we have run has moved in the right direction. Not by the same amount, and not on every criterion - but no cohort has finished a cycle behind where it started.
Individual schools, groups and institutional networks across India.
Observed and profiled across external, internal, peer and self audits.
Assessed against criterion-mapped instruments, Early Years to Class 12.
Completed student assessments, each scored criterion by criterion.
Classroom observations rated against written expectation statements.
Student, section, class, school and observation reports, written in plain language.
Growth is measured baseline to endline on students present at both points and reported with effect size. Reports are counted across all five levels - student, section, class, school and teacher observation - which is why the report count runs ahead of the assessment count.
Figures as of August 2026Bring IMPACT to your next set of results, and read what they really mean.


